Methodology
Transparent scoring, open sources
Every destination is scored using publicly available data across eight research-backed facets. Each metric is documented, normalized to a 0–100 scale, and updated on a regular cycle. Nothing is hidden.
Governance
12% defaultMeasures democratic participation, corruption levels, press freedom, rule of law, and judicial independence.
Sources: Transparency International CPI, Reporters Without Borders Press Freedom Index, World Justice Project Rule of Law Index, V-Dem Democracy Indices, Freedom House.
Economics
18%Evaluates cost-of-living ratio relative to income, tax burden, ease of doing business, labor protections, income inequality (Gini), property ownership rules, and banking access for foreigners.
Sources: Numbeo, World Bank Open Data, OECD Statistics, Heritage Foundation Economic Freedom Index.
Safety
13%Covers regional violent crime rates, political stability trends, natural disaster exposure, and emergency service quality.
Sources: UNODC, World Bank Worldwide Governance Indicators, EM-DAT International Disaster Database.
Health
13% defaultAssesses healthcare access, out-of-pocket costs, wait times, mental health services, air quality, and life expectancy.
Sources: WHO Global Health Observatory, HAQ Index, IQAir, Numbeo Health Care Index.
Education
12%Scores public school quality, international school availability, higher education access, and language of instruction.
Sources: OECD PISA Results, ISC Research, UNESCO Institute for Statistics.
Culture
7%Evaluates English proficiency, social integration ease, LGBTQ+ safety, religious tolerance, internet speed, and climate preferences.
Sources: EF English Proficiency Index, ILGA World, Ookla Speedtest Global Index, InterNations Expat Insider Survey.
Mobility
9%Measures visa pathway complexity, passport power, flight connectivity, dual citizenship rules, and time zone difference from home country.
Sources: Henley Passport Index, government immigration authority websites, FlightConnections route data.
Acceptance & Inclusion
16% defaultPersonalized scoring across three layers: legal protections, social acceptance, and on-the-ground safety. Scores adjust based on your profile. A destination produces different acceptance scores for different users.
Sub-scores include LGBTQ+ legal protections, marriage equality, anti-discrimination laws, racial tolerance indices, religious freedom, gender equality metrics, and expat social integration data.
Sources: ILGA World Database, Equaldex, Social Progress Index, World Values Survey, Pew Global Attitudes, UN Human Development Reports.
Normalization
Each metric normalizes to a 0–100 scale using min-max normalization against the full destination set. Higher scores indicate more favorable conditions. Composite facet scores are the weighted average of their component metrics. Final destination scores are the weighted average of all eight facets using your preference weights.
Responsible Use: Acceptance
The Acceptance facet follows an asymmetric design principle: it exists to protect vulnerable users, never to sort or filter by demographics.
Acceptance scores are personalized — the same destination produces different scores depending on your profile. No demographic filtering is possible.
Acceptance profile data receives elevated privacy protections: encrypted at rest, never aggregated across users, and deletable on request.
Your priorities, your rules
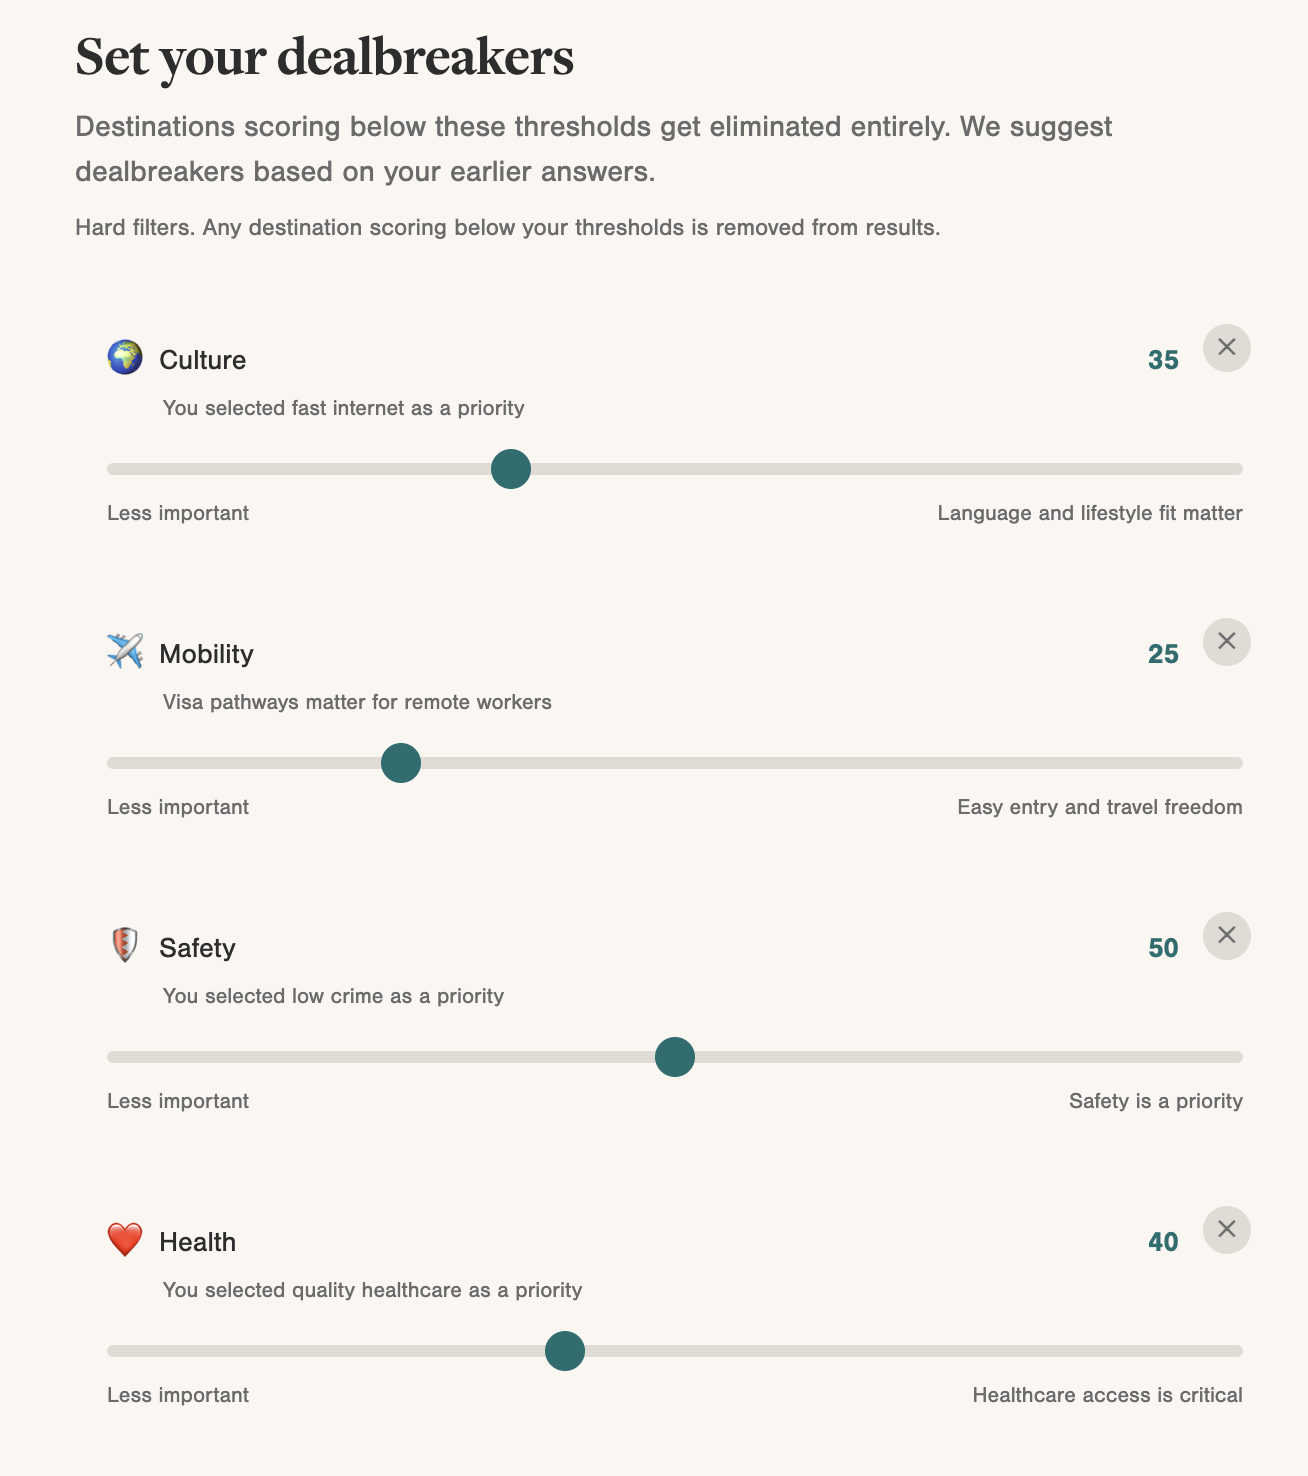
Dealbreakers flag, not just downrank
Most tools bury bad scores in an average. WhereToAdvisor treats dealbreakers as clear warnings — any destination scoring below your threshold on a category is flagged with an amber warning so you can make an informed decision.
The quiz suggests dealbreakers based on your earlier answers. If you told us you're a remote worker, we'll suggest a mobility threshold. Selected “low crime” as a priority? Safety gets a floor. You can adjust every slider or remove it entirely.
- Smart suggestions
- Based on your life stage, income source, and stated priorities.
- Clear warnings
- Destinations below your threshold are flagged, never hidden.
- Fully adjustable
- Drag any slider or remove a dealbreaker entirely — it's your call.
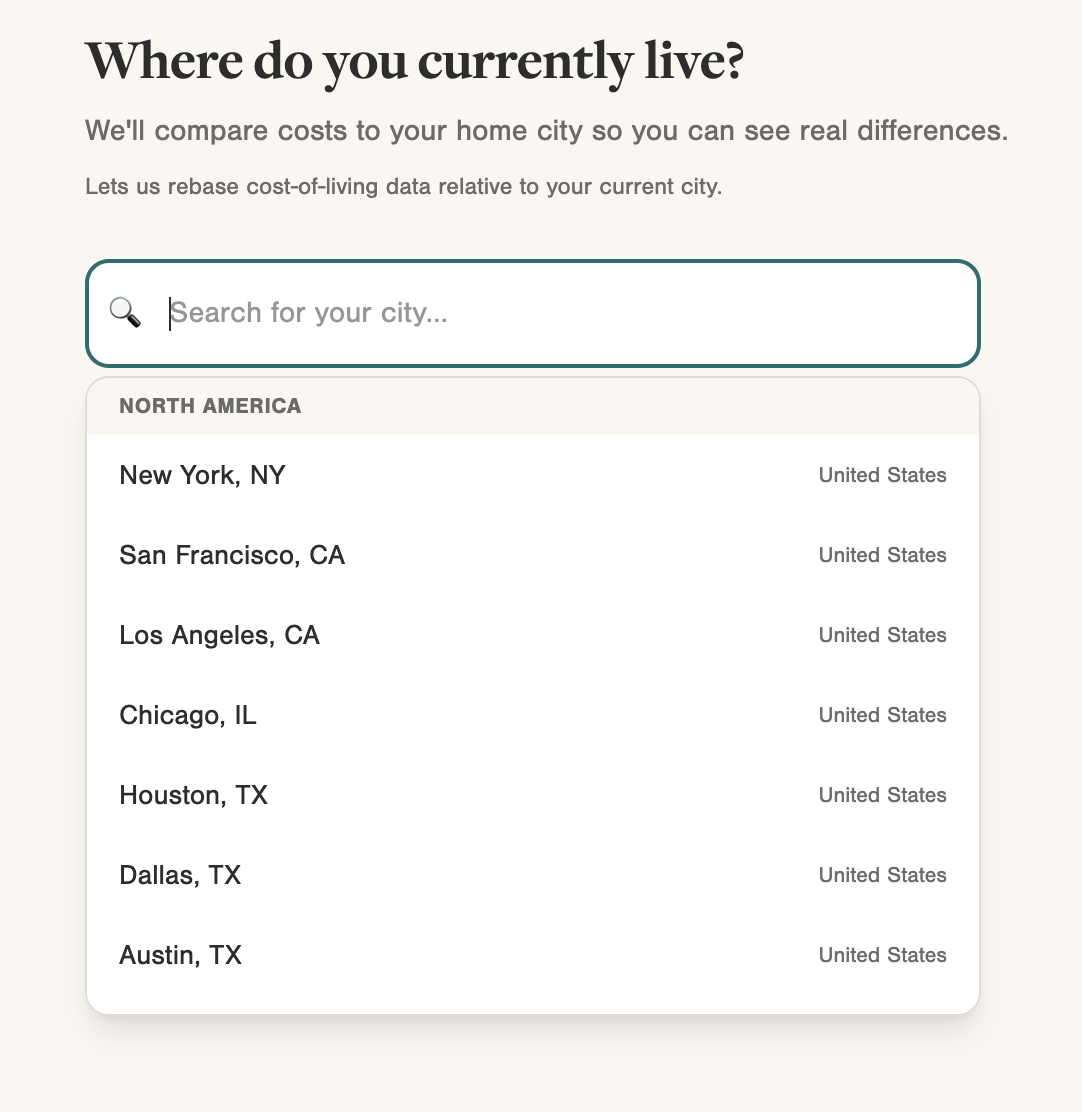
Personalized comparisons
Costs relative to where you live now
Generic cost-of-living indices don't mean much on their own. Knowing that Lisbon scores 42 on a global index doesn't tell you what that means for your budget.
By selecting your current city, we rebase every economic metric — rent, groceries, dining, and purchasing power — relative to what you're paying today. Instead of abstract indices, you see “32% cheaper rent than Chicago” or “15% more purchasing power than Austin.”
The dashed baseline in every cost chart is your city, so you can instantly see which destinations will stretch your budget and which will squeeze it.